blog
The Best Alert and Notification Tools for PostgreSQL

As part of their enterprise monitoring system, organizations rely on alerts and notifications as their first line of defense to achieving high availability and consequently lowering outage costs.
Alerts and notifications are sometimes used interchangeably, for example we can say “I have received a high load system alert”, and replacing “alert” with “notification” will not change the message meaning. However, in the world of management systems it is important to note the difference: alerts are events generated as a result of a system trouble and notifications are used to deliver information about system status, including trouble. As an example the Severalnines blog Introducing the ClusterControl Alerting Integrations discusses one of the ClusterControl’s integration features, the notification system which is able to deliver alerts via email, chat services, and incident management systems. Also see PostgreSQL Wiki — Alerts and Status Notifications.
In order to accurately monitor the PostgreSQL database activity, a management system relies on the database activity metrics, custom features or monitor advisors, and monitoring log files.
In this article I review the tools listed in the PostgreSQL Wiki, the Monitoring and PostgreSQL GUI sections, skipping those that aren’t actively maintained, or do not provide alerting and notifications either within the product or with a free trial account. While not an exhaustive review, each tool was installed and configured up to the point where I could understand its alerting and notification capabilities.
Nagios
Nagios is a popular on-premise, general purpose monitoring system that offers an wide range of plugins. While Nagios Core is open source, the recommended solution for monitoring PostgreSQL is Nagios XI.
Notification settings are per user, and in order to change them the administrator must “login as” the user — Nagios uses the term masquerade as. Once on the account setting page, the user can choose to enable or disable the notification methods:
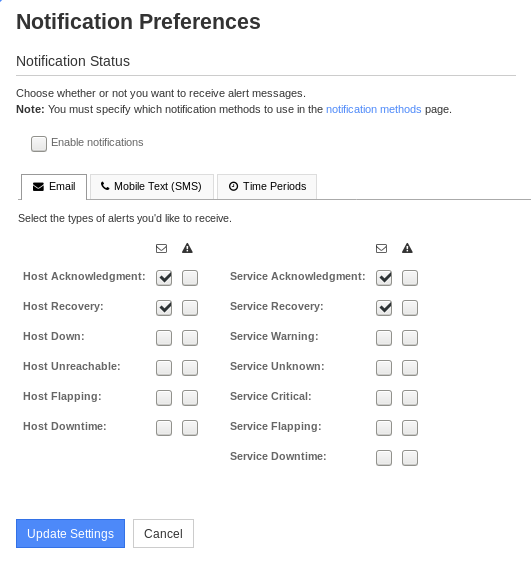
In order to configure the types of notifications, head to the “Notification Methods” page:
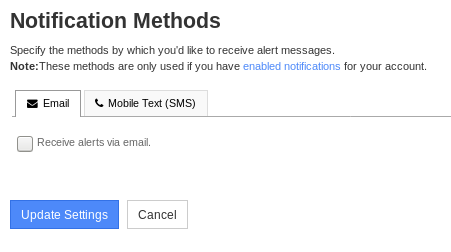
See the Nagios XI User Guide for more details.
To configure alerts, log in as administrator and select the database configuration wizard:
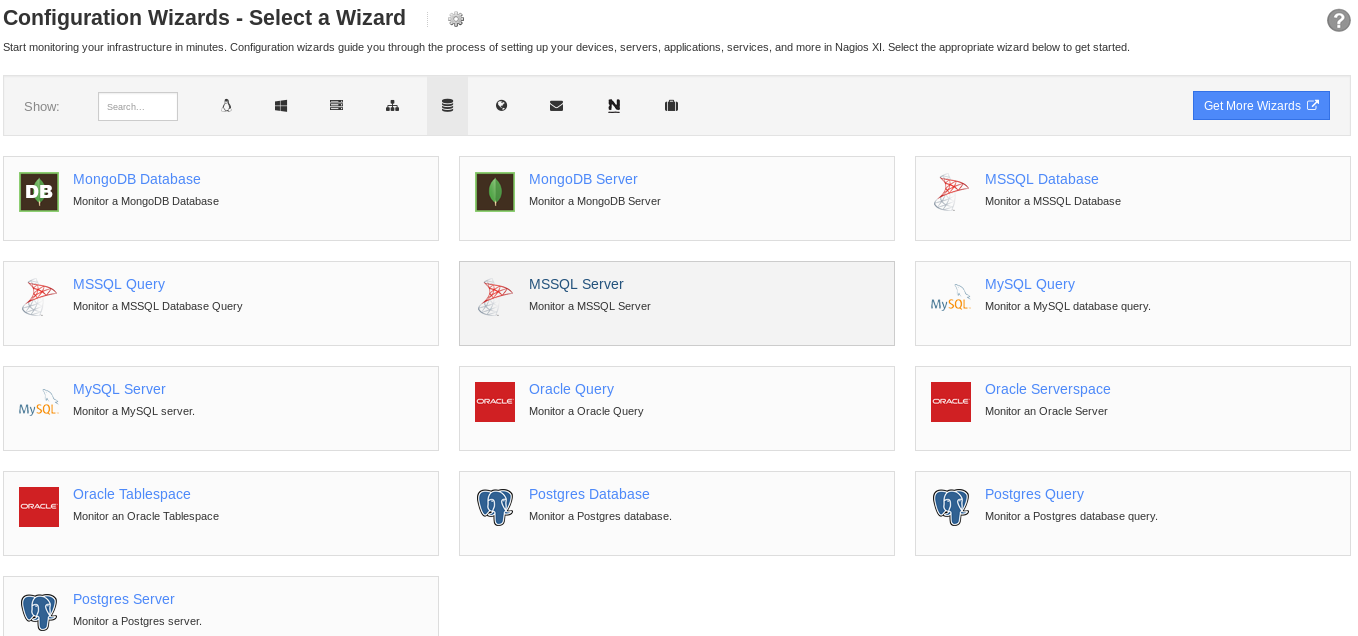
Once configured, the alerts can be viewed by selecting any of the default views, dashboards, or we can configure a custom one. Out of the box, Nagios XI provides the following PostgreSQL monitors:

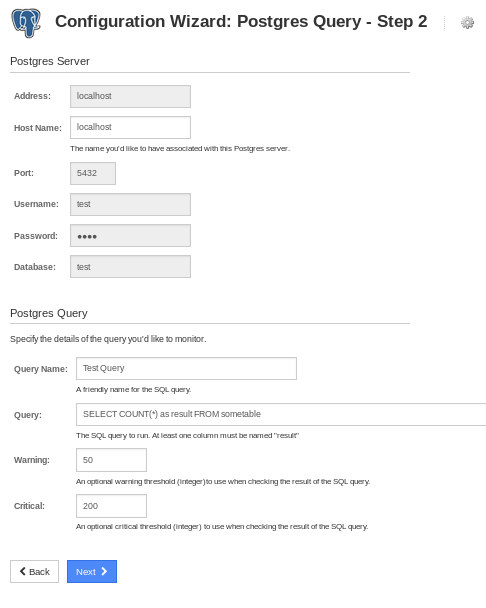
Note that out of the box Nagios XI doesn’t provide any metrics based on the PostgreSQL Statistics Collector, instead each metric must be defined using the “Postgres Query” configuration wizard:
Datadog
Datadog is a general purpose SaaS monitoring tool featuring a very large set of integrations with a variety of services. To start monitoring, select the PostgreSQL integration, and then choose the notifications integrations such as email, chat (e.g. Slack), or incident response systems such as PagerDuty:
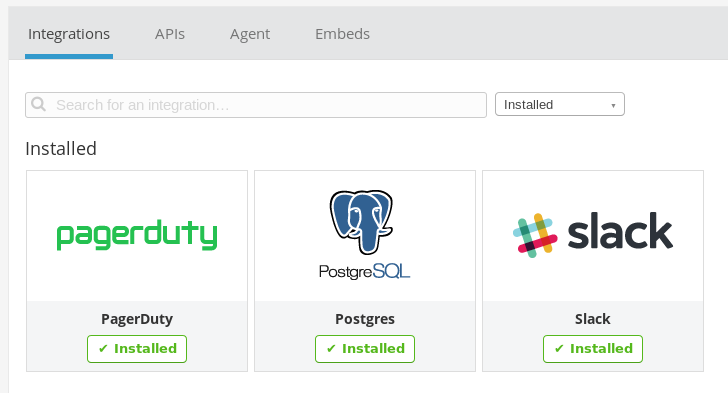
In order to receive notifications via the integration channels configured earlier, we need to create at least one Datadog monitor, in the case of PostgreSQL monitoring an “integration” monitor type:
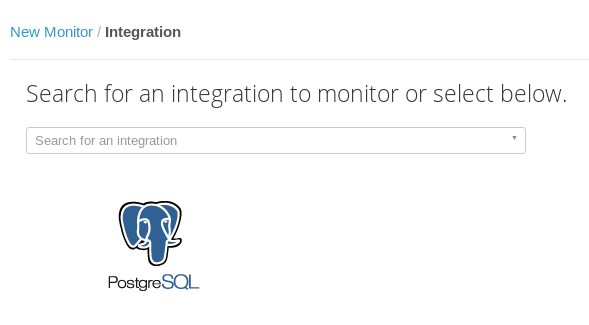
The first step in configuring the monitor is selecting an alert type:

Next, configure one or more metrics:

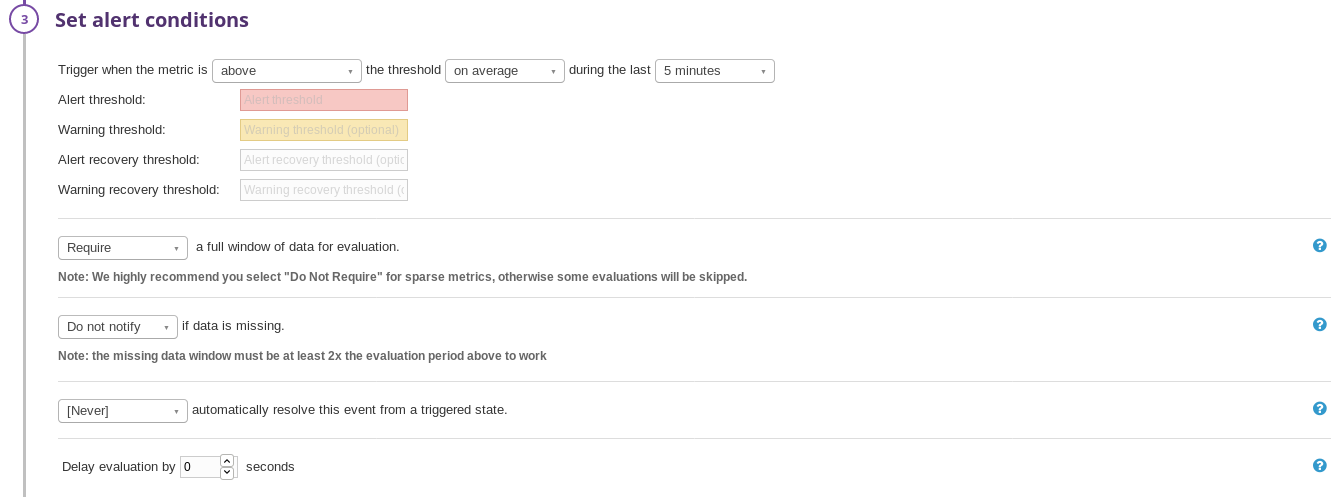
Configure the conditions for triggering the alert:
Notifications can be customized using template variables:
Finally provide a list of recipients to receive notifications:

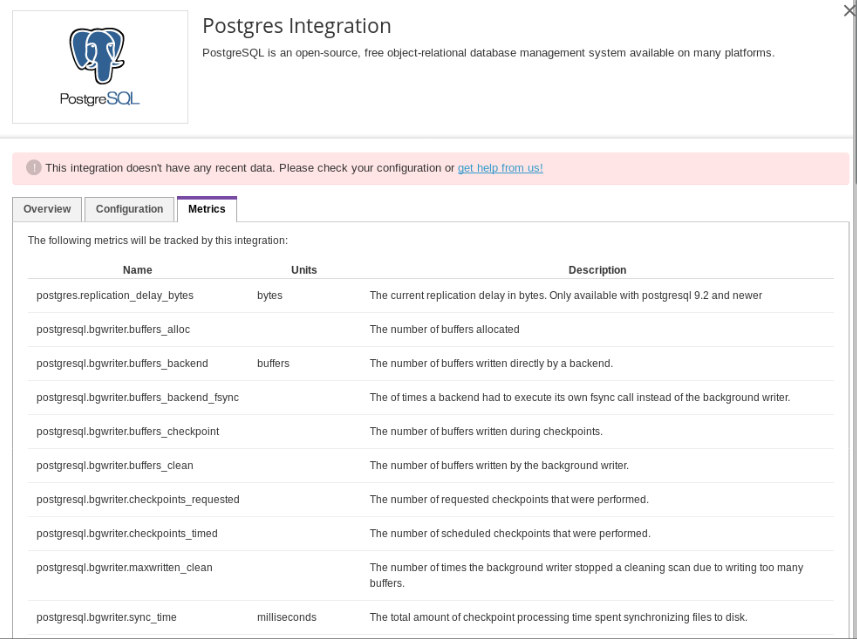
The events Datadog can monitor on are listed under the PostgreSQL integration “Metrics” section, and are based on the PostgreSQL Statistics Collector predefined views:
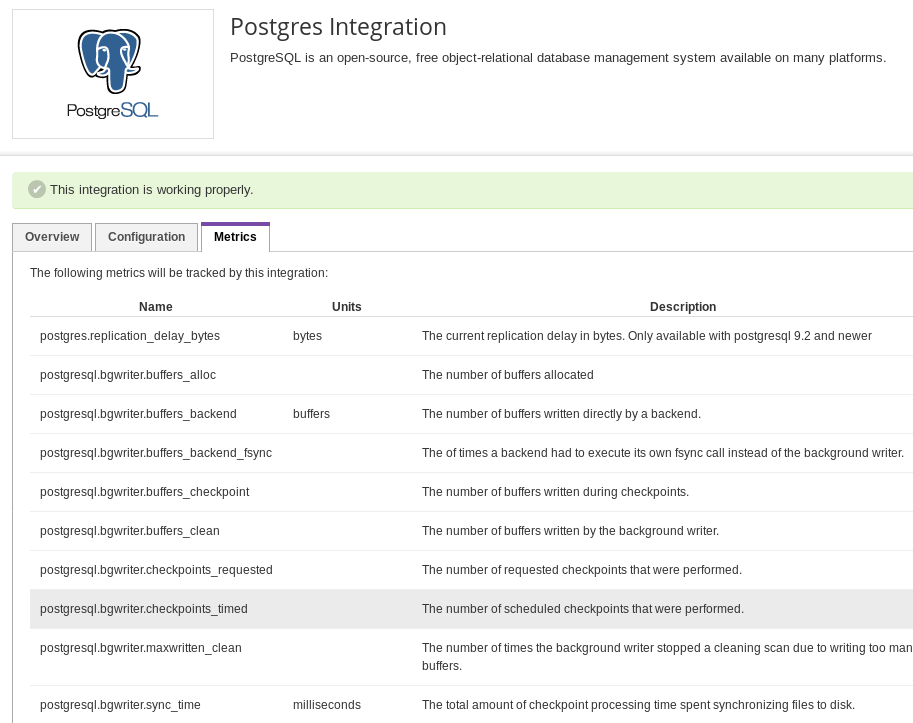
In order to monitor for events not provided with the default integration, Datadog provides customers with the option of creating custom metrics limited to the Datadog plan.
Okmeter
Okmeter is also part of the SaaS general purpose monitoring family, and just as other SaaS tools, requires an agent on the monitored host. Once the agent is installed, a set of default event triggers are enabled, including a PostgreSQL connection check:
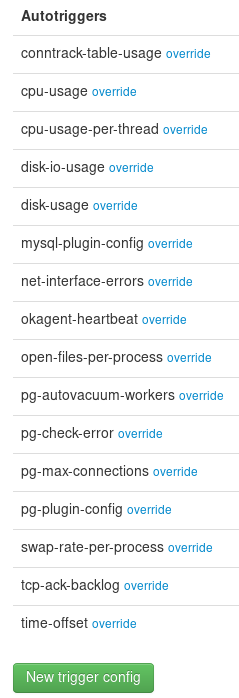
Getting more PostgreSQL metrics requires adding a PostgreSQL “server”:
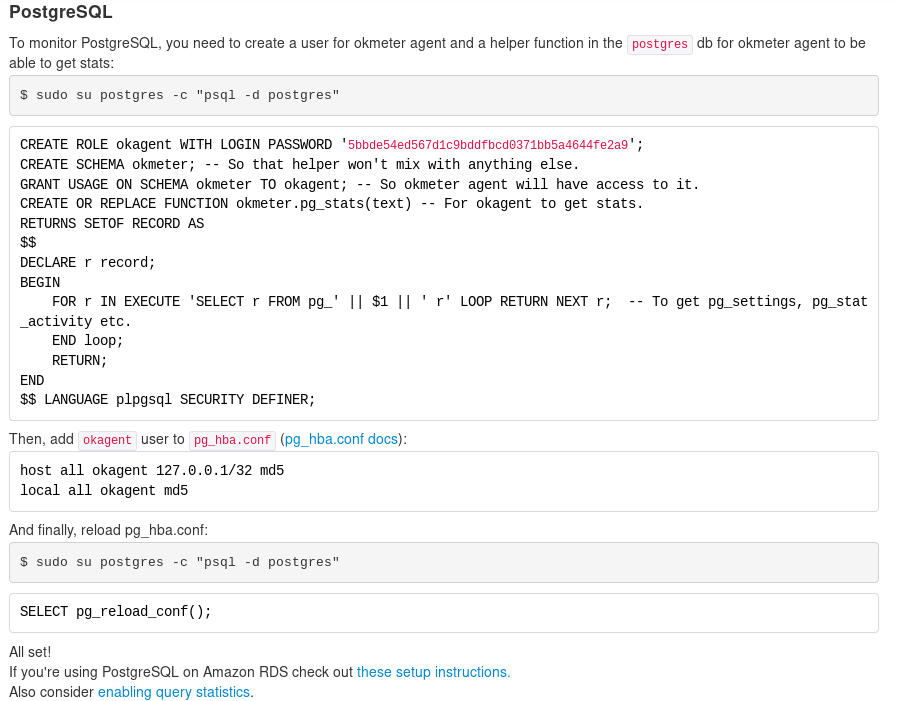
In order to monitor PostgreSQL statistics, similarly to Nagios and Datadog, we must configure custom metrics as explained in the Okmeter Documentation — Sending Custom metrics. Or, edit the “PostgreSQL server” metric above to include for views in the “okmeter.pg_stats” function.
The Okmeter query statistics documentation page explains how to enable tracking of execution statistics for the SQL statements. Note that there are a few limitations in using the “pg_stat_statements” views e.g. maximum number of distinct statements that can be recorded by a module — see the PostgreSQL documentation on pg_stat_statements for details.
The notification contacts page is where notifications are configured for each user:
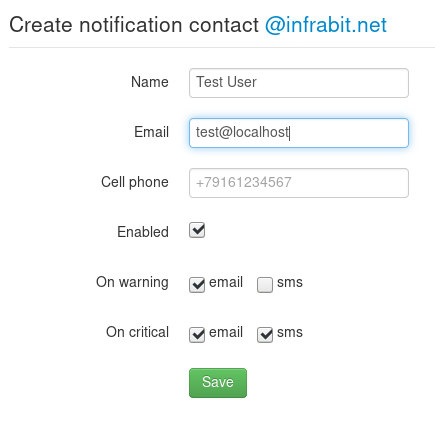
Notification messages can be further customized using templates:
Circonus
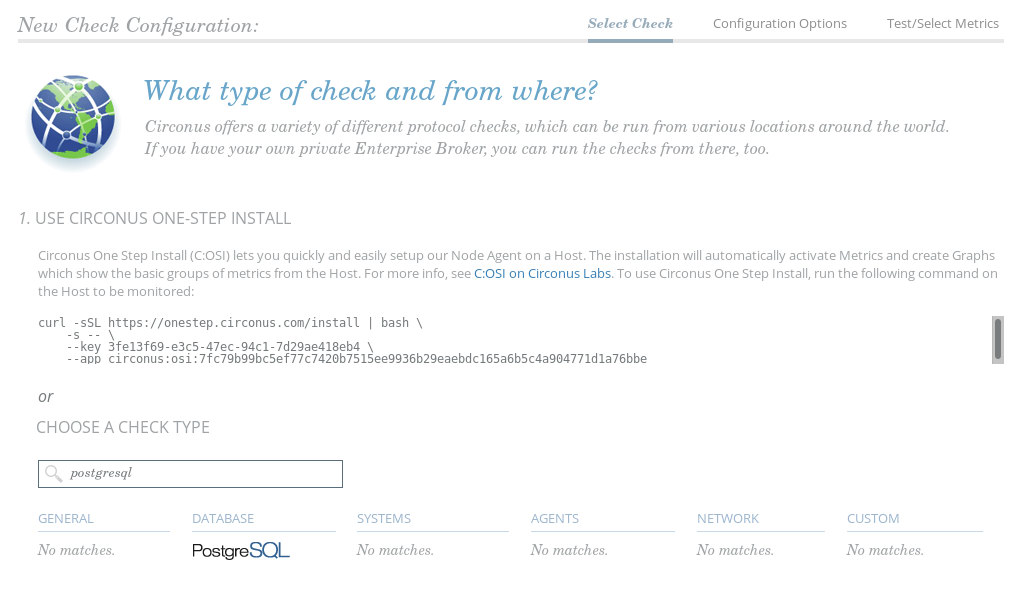
Circonus, another SaaS general monitoring product, features a PostgreSQL “check” which can be enabled individually or added as part of the one-step install:
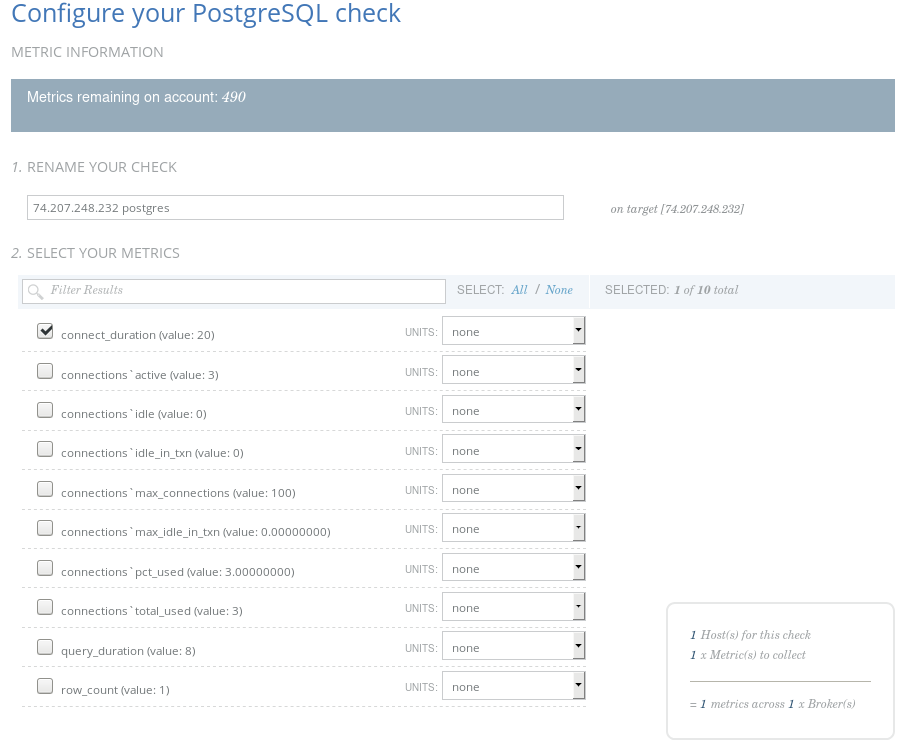
According to Circonus PostgreSQL documentation the check is performed from a remote location via direct SQL statements. After configuring the PostgreSQL host to accept connections from a Circonus broker, the wizard will present a list of available metrics:
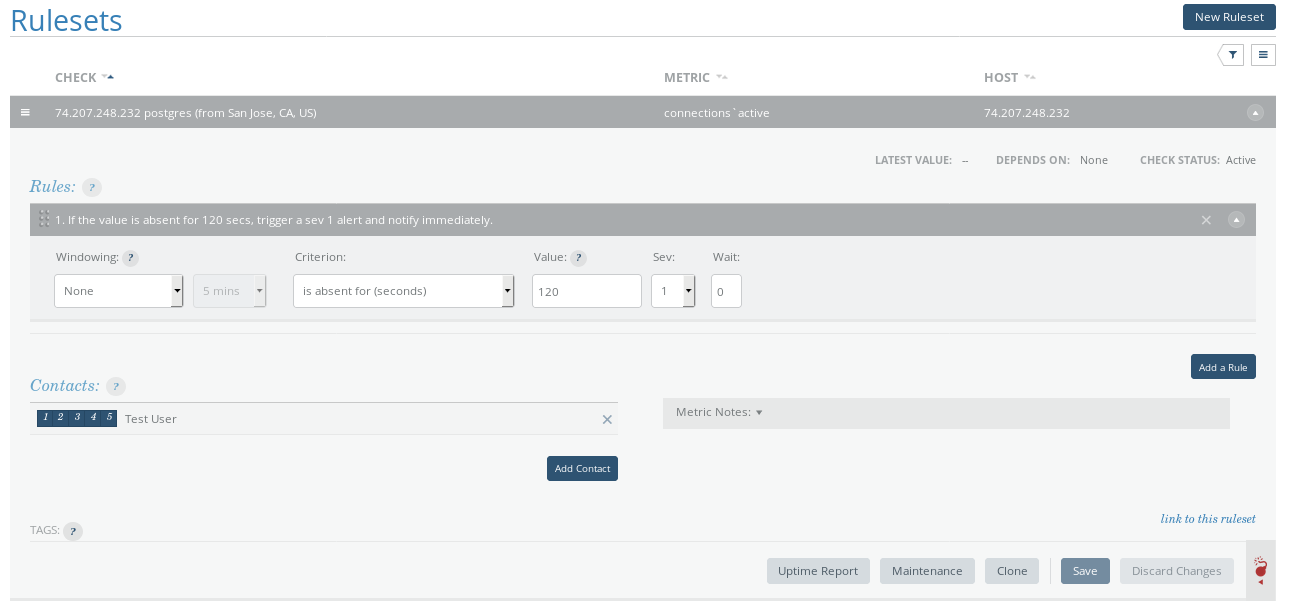
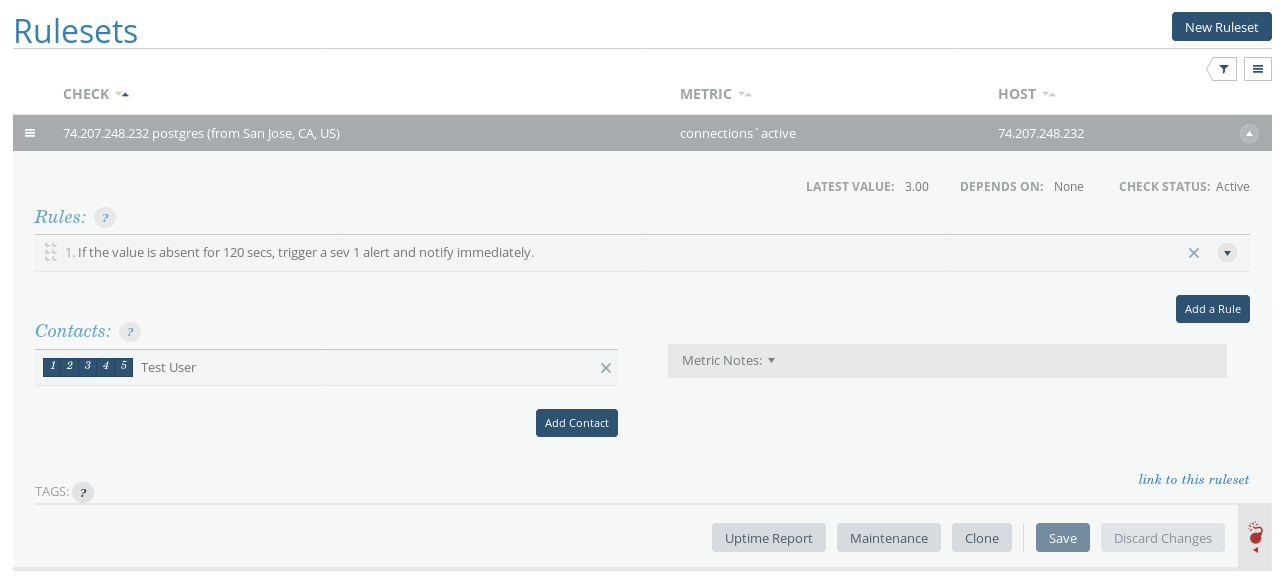
In order to configure alerts, each metric is associated with a set of rules and a list of contacts to be notified.
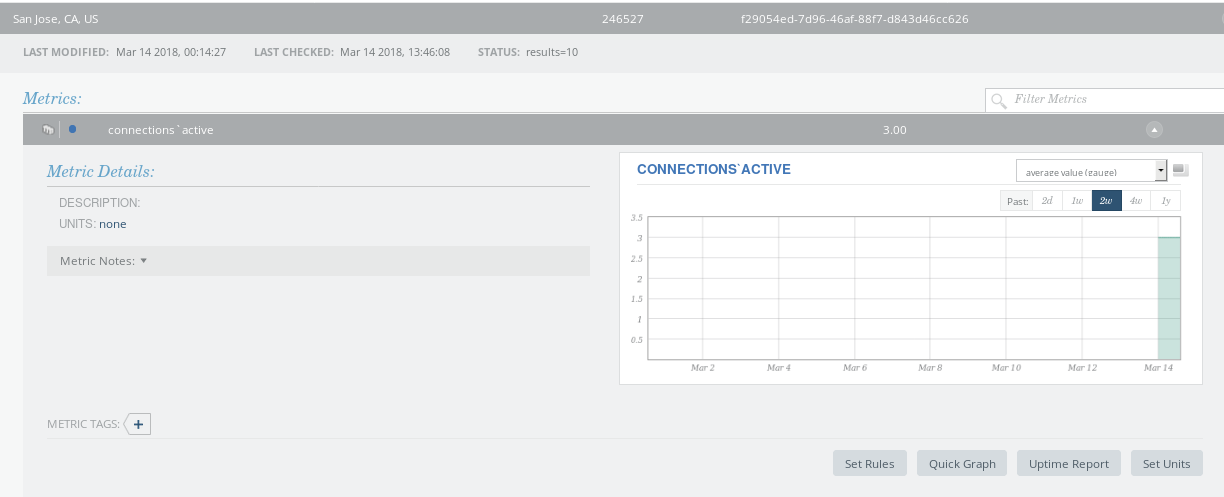
Alerts are categorized based on severity levels:
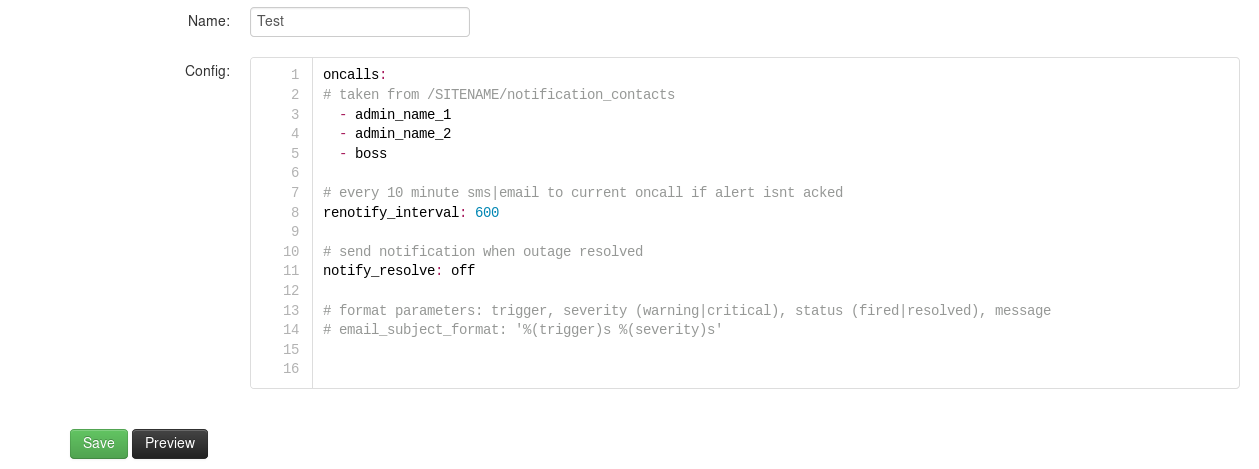
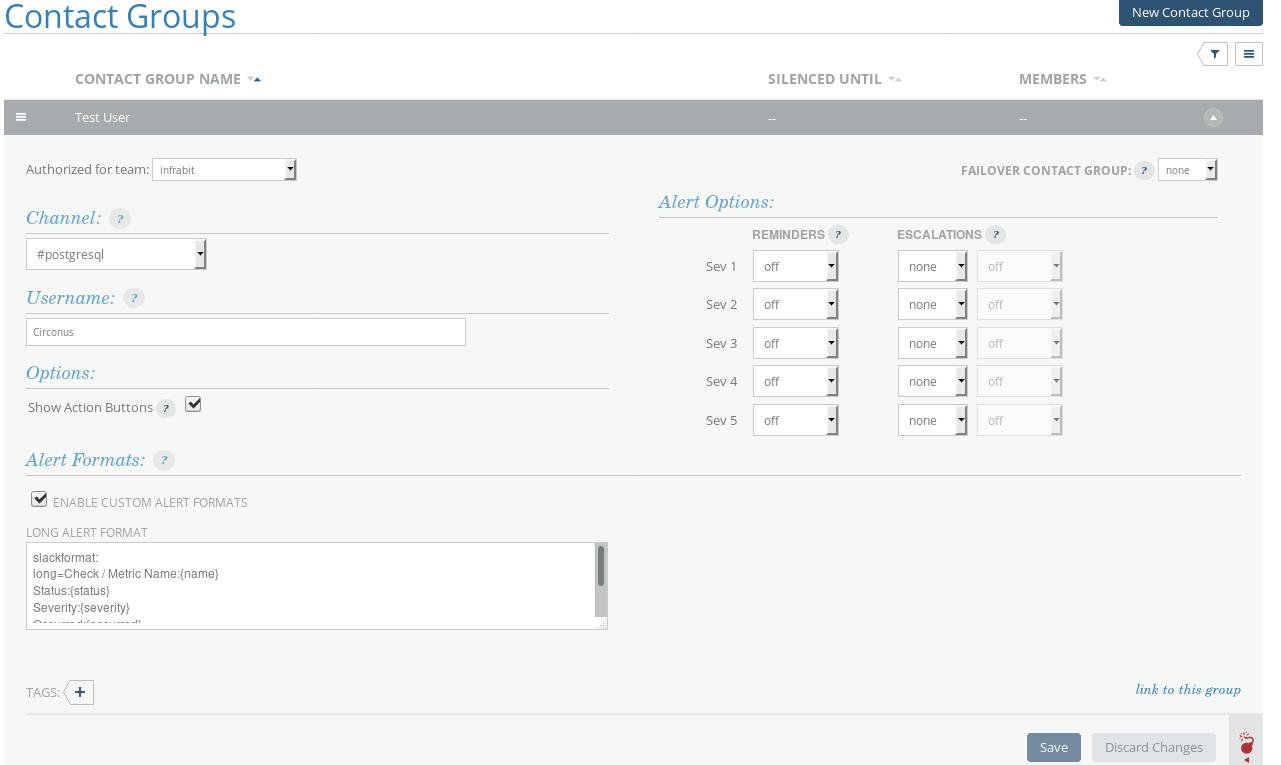
Notification channels include SMS, OpsGenie, Slack, VictorOps, and PagerDuty (no email). The screenshot below shows a Slack integration:
In order to configure notifications, each metric in the check must be assigned rules and contacts. Note that contacts must be created prior to editing the metric:
New Relic
New Relic is another SaaS general monitoring system. When it comes to PostgreSQL there are (as of this writing) three available plugins. The most recent one is the Blue Medora plugin:

Once the plugin is working it becomes visible on the plugins page and we are ready to configure alerts:
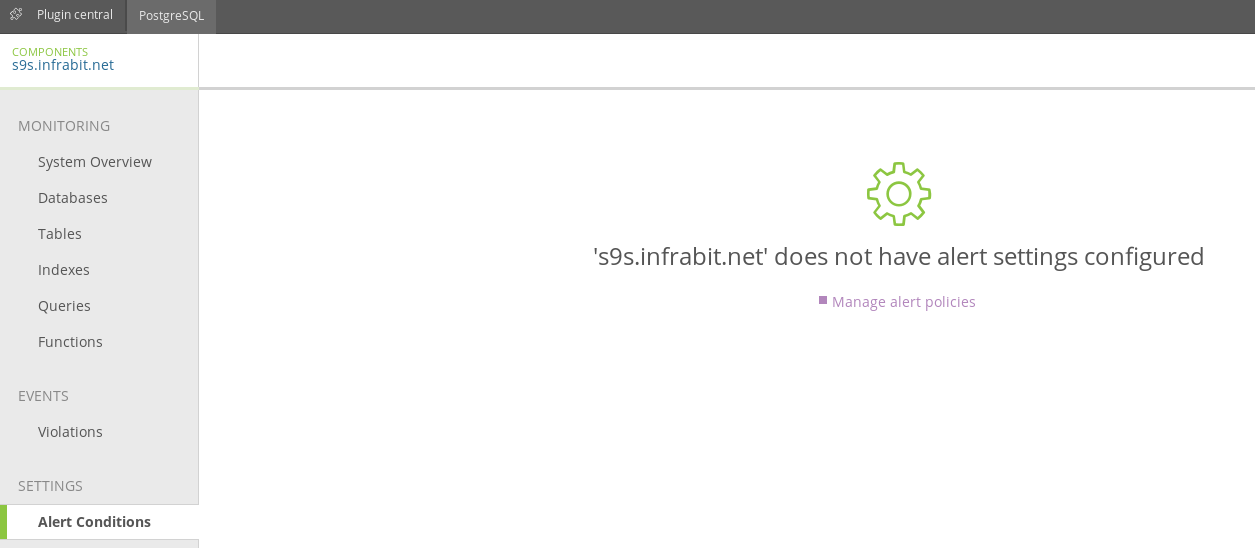
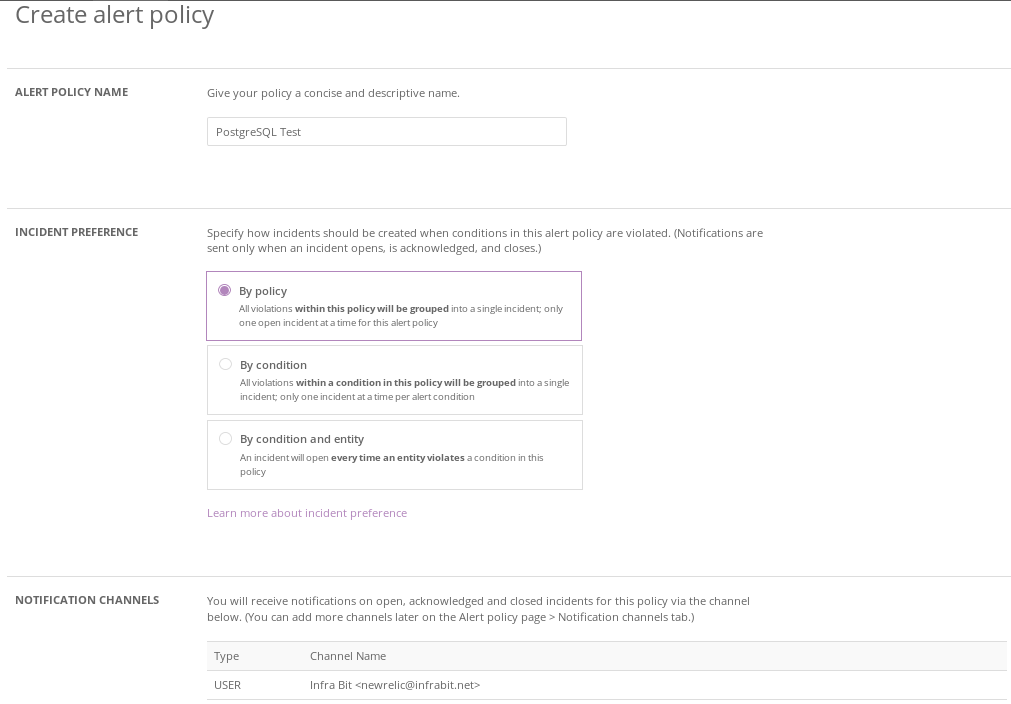
New Relic uses the concept of alert policies to group alerts into incidents. Before configuring a policy we must setup the notifications channels. Out of the box, New Relic integrates with all popular incident response systems, as well as email:
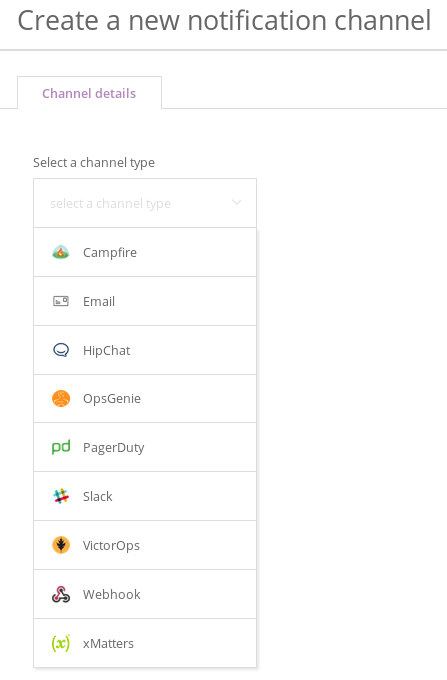
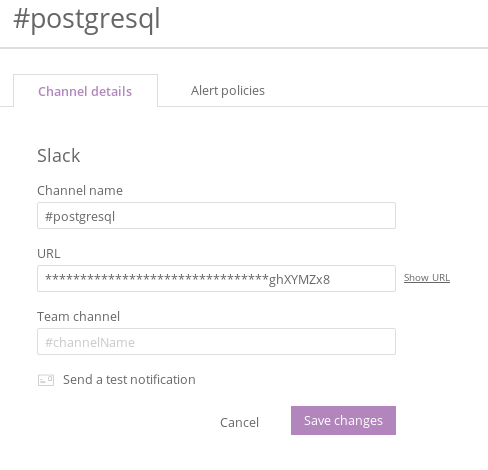
Note that the integration must be first enabled in the notification application. For example selecting Slack from the list of channel types:
Next create an “alert policy”:
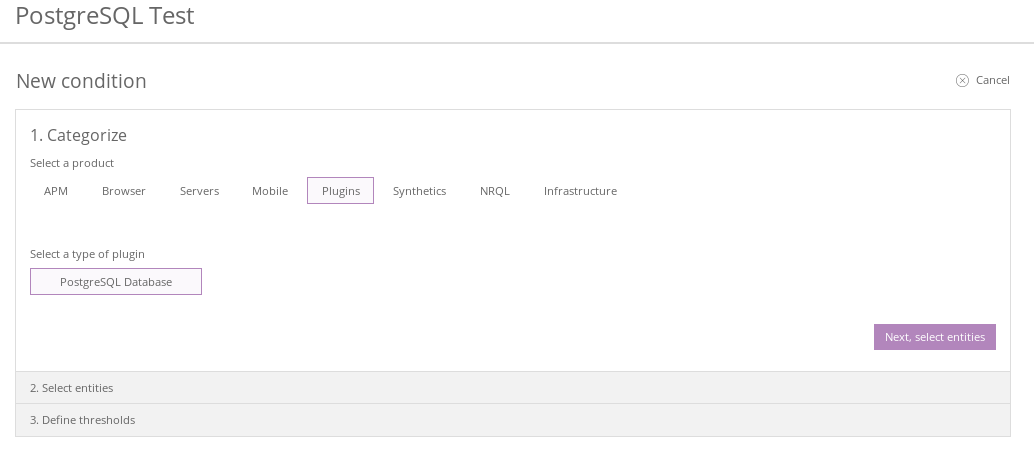
An alert policy requires an “alert condition”. The next set of screenshots show the steps to achieve just that:
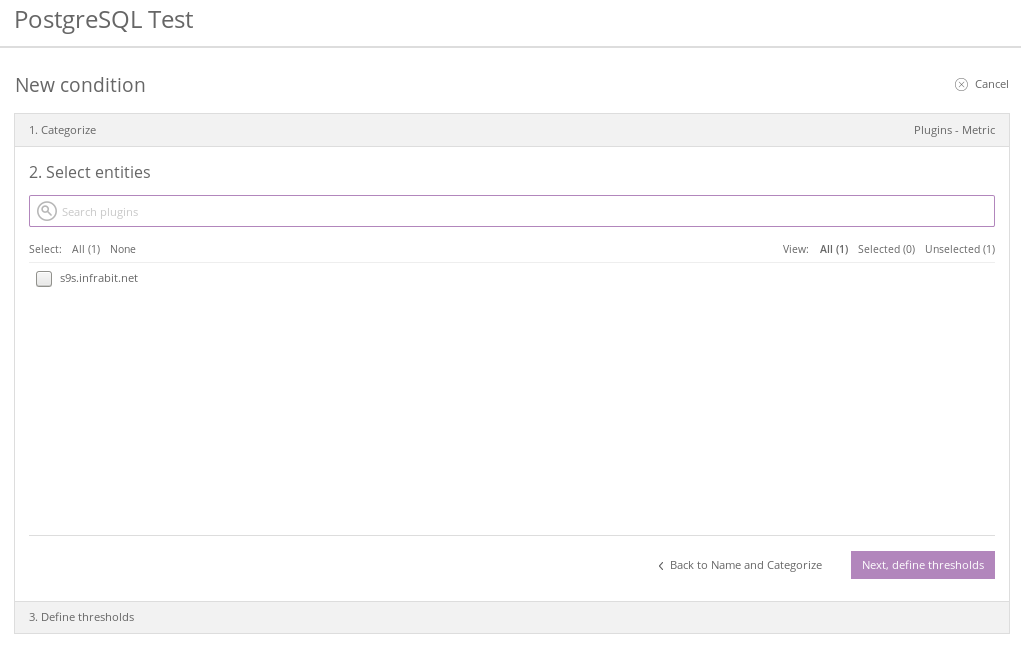
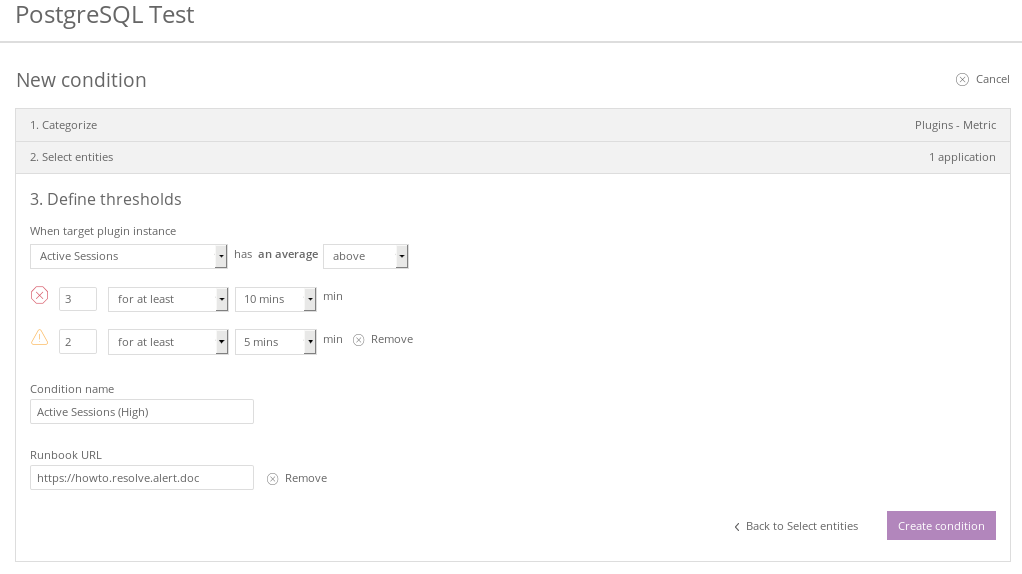
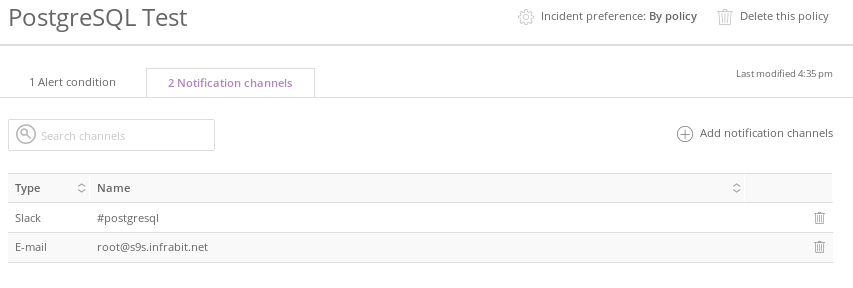
Finally select the notification channels tab in order to modify the default:
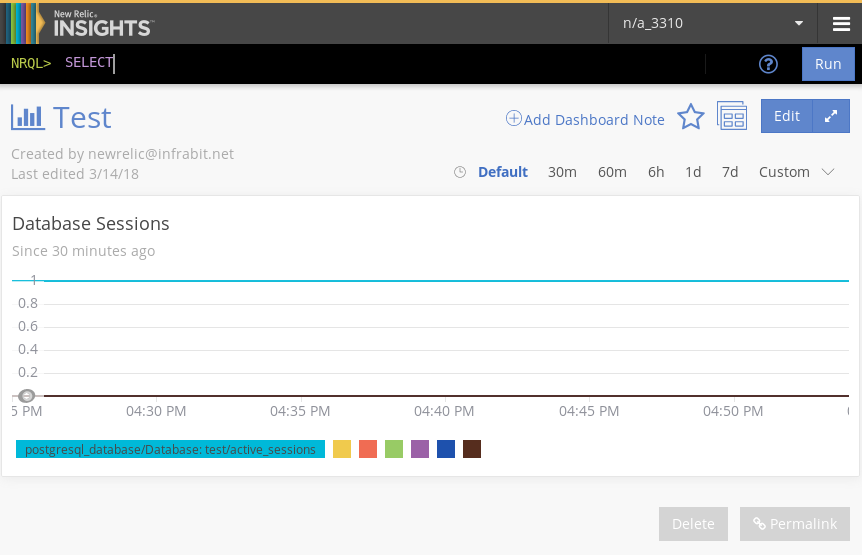
Optionally, add the alert condition to New Relic Insights (requires additional subscription):
Postgres Enterprise Manager
PEM or Postgres Enterprise Manager is a tool for managing, tuning, and monitoring PostgreSQL.
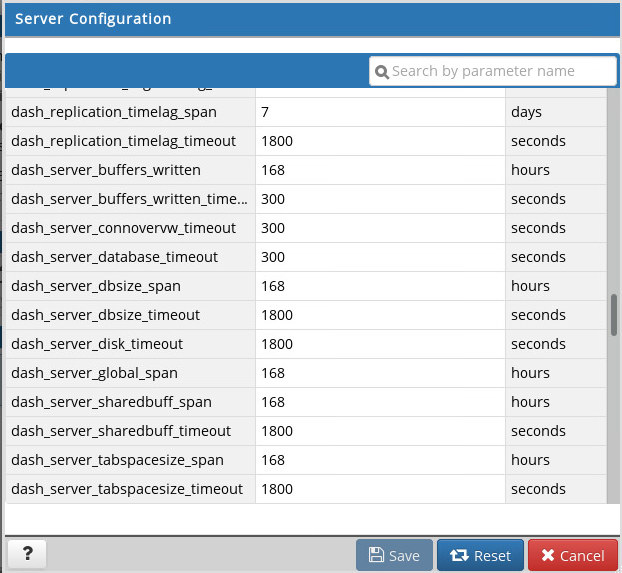
It comes with a very rich set of predefined metrics:
In order to modify the default alerts, or create custom ones, use the alert templates:
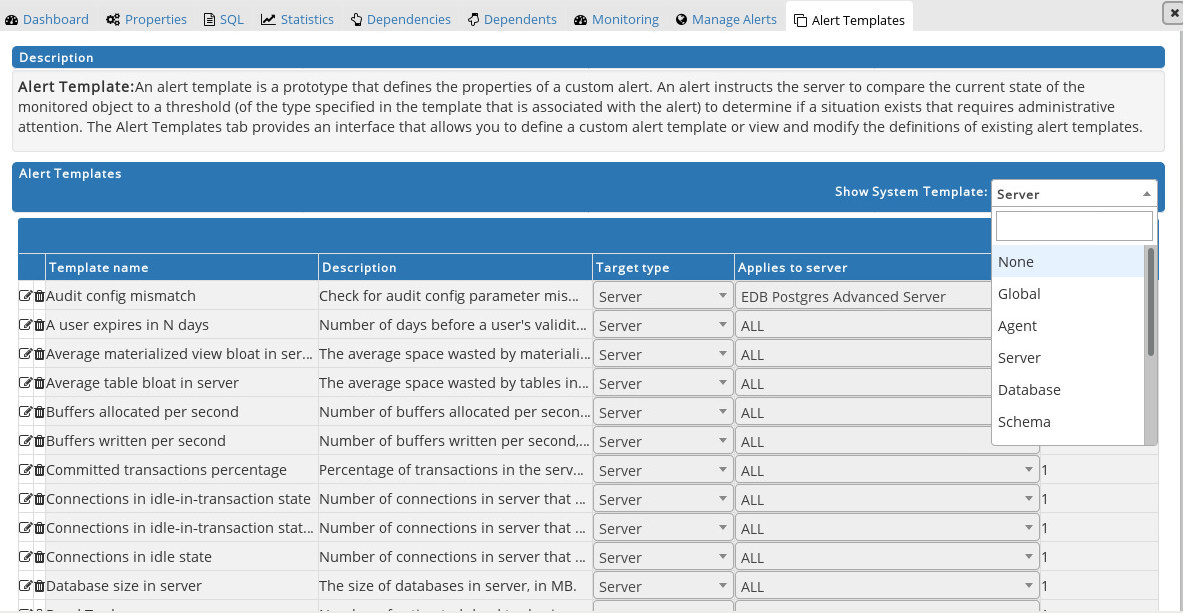
PEM relies on email and SNMP for notifications, so it can easily integrate with monitoring systems such as Nagios, but there aren’t any integrations with the popular incident management systems (PagerDuty, VictorOps, OpsGenie), or chat services (Slack) found in the other products.

pgwatch2
pgwatch2 is another PostgreSQL centric monitoring tool, self-hosted solution.
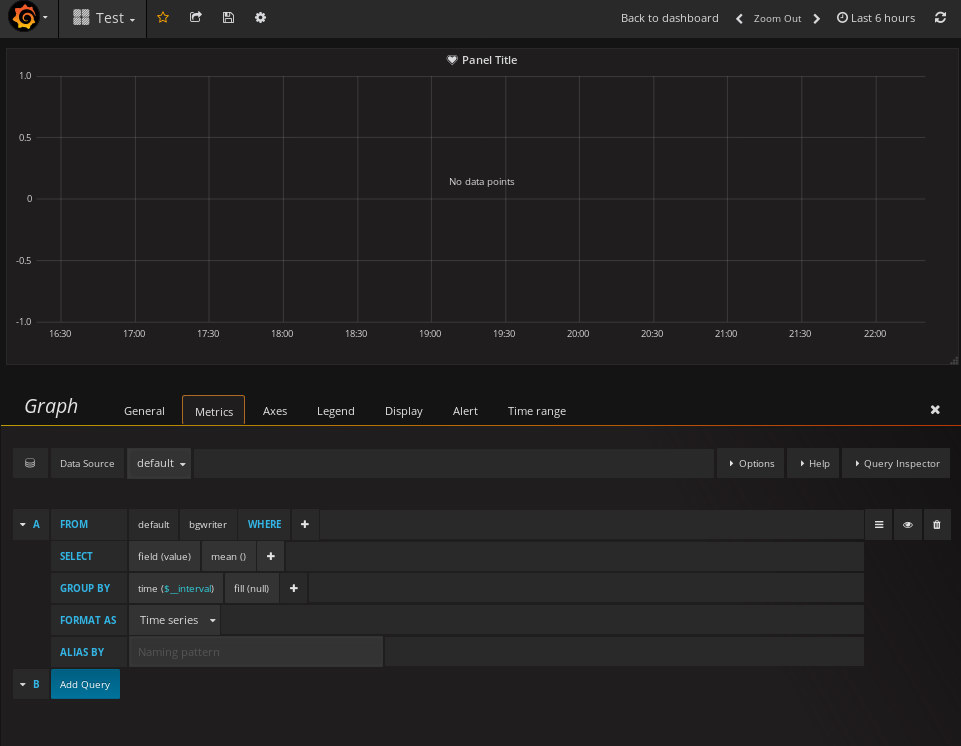
In order to define alerts, we must first create a custom dashboard and define the metric:
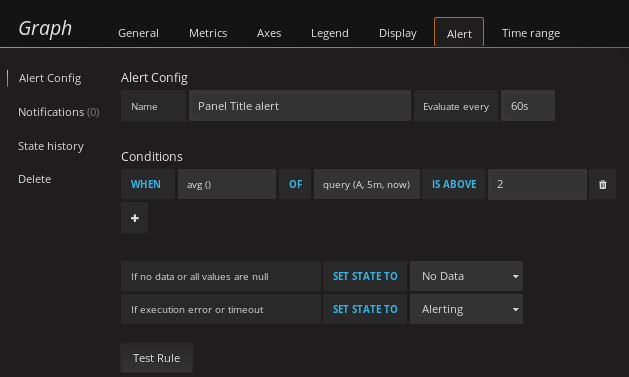
Next, configure the alert:
Once configured, the alerts will show up on the Alerts List page:

pgwatch2 integrates with all popular notification systems. Here’s an example of adding a Slack channel:
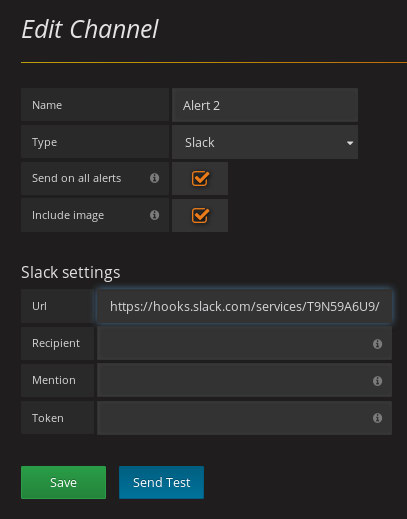
To view the notification channels configured in the system, open up the “Notification channels” page:

Additional metrics can be added as documented in the pgwatch2 Features section.
ClusterControl
ClusterControl is an on premise database oriented management system with support for PostgreSQL, MySQL, MariaDB, and MongoDB.
First step is adding a notification integration. More information about available integrations is available at Introducing the ClusterControl Alerting Integrations:
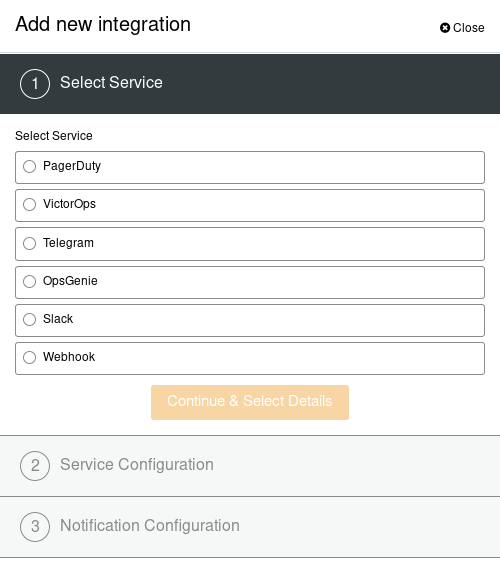
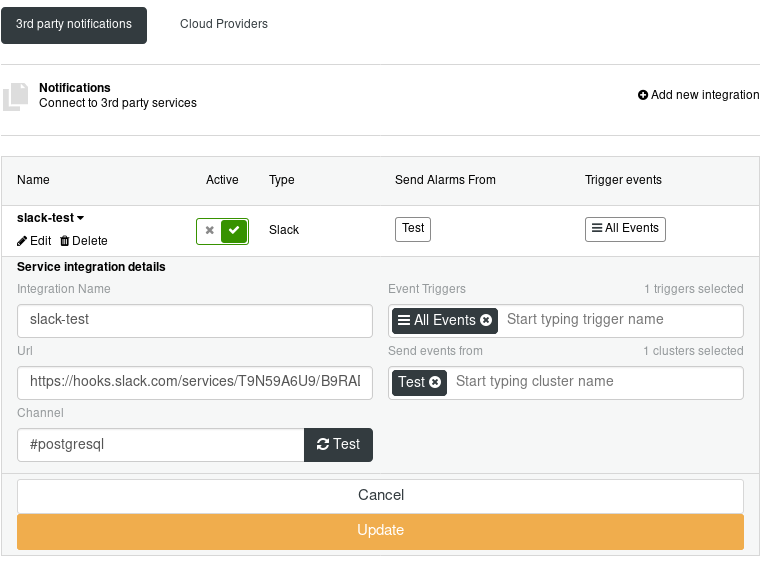
For the purpose of this demo, I’ve configured Slack:
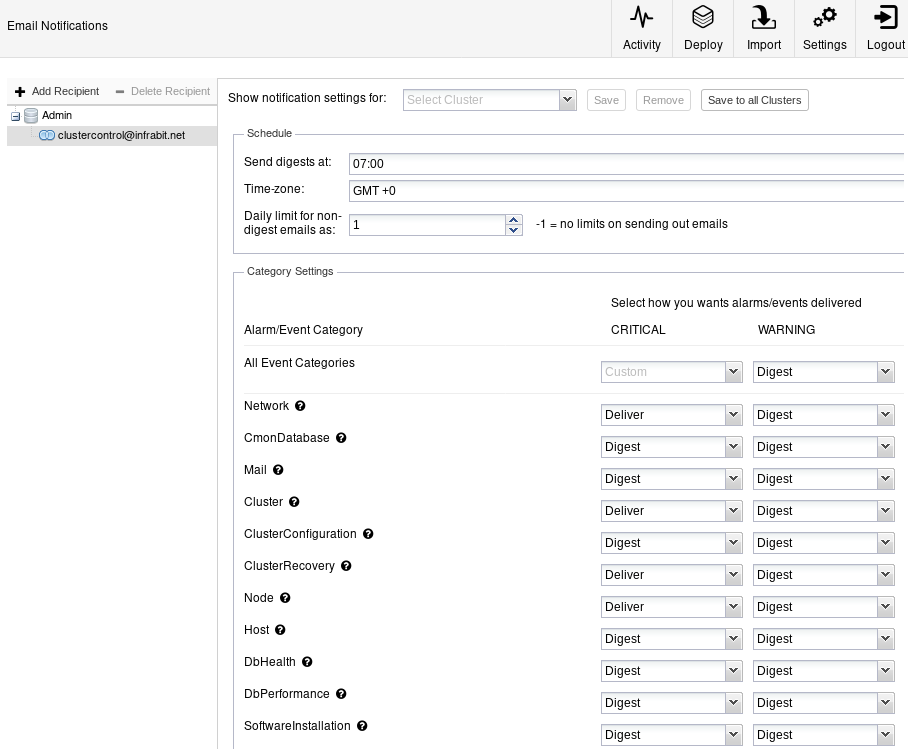
ClusterControl also offers the option of notifying via email:
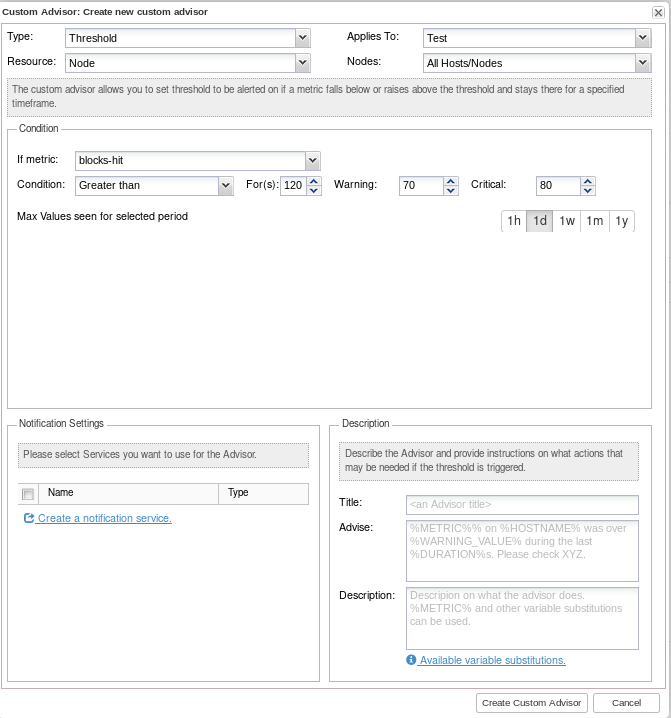
Once notifications are in place, create custom advisors in order to trigger alerts based on specific criteria:
Conclusion
The article wasn’t intended to be a deep dive into the functionality of each tool, rather I attempted to outline what I considered to be the important features related to alerting and notifications for PostgreSQL, specifically.
One of the lessons learned is that the selection process should take several factors in consideration:
- on premise or SaaS
- agent-based or remote check
- integration with incident management systems and chat services
- availability of monitored metrics, out of the box, and plugins
- ability to add custom metrics
- alert management features (e.g. grouping)
- complexity vs granularity in the user interface
- additional functionality (management, tuning, API, etc.)
Also, if one solution doesn’t meet all the business and/or technical requirements, it is always possible to use a combination of services.